Statistics explained
Powerball Odd and Even Patterns Explained
By MyBallWin · Reviewed · 2 min read
An odd/even pattern counts how many of the five white balls are odd and how many are even. Some categories contain more possible combinations than others, but every specific valid five-number set remains equally likely in a fair drawing.
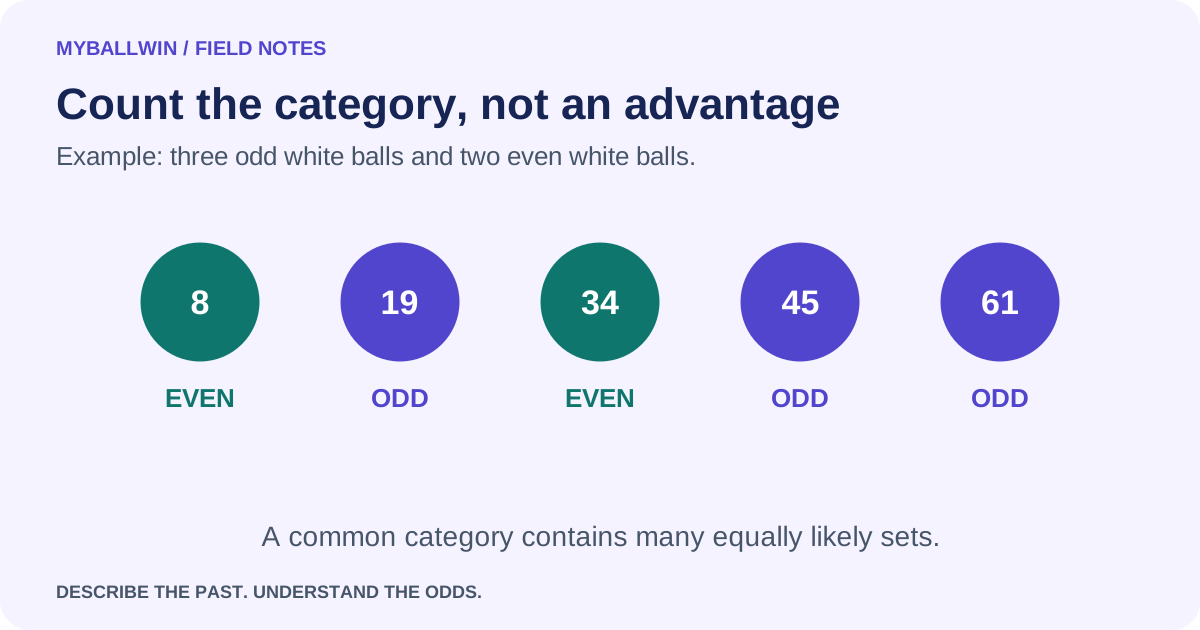
Classify the white balls only
In an illustrative line with white balls 8, 19, 34, 45, and 61, the odd numbers are 19, 45, and 61. Its pattern is therefore three odd and two even. Keep the red Powerball outside this five-ball classification. If a chart includes it, that chart describes a different six-number statistic and must say so explicitly.
The eligible white-ball integers contain 35 odd numbers and 34 even numbers. There are six possible odd-count categories, from zero through five. This small imbalance means that three-odd and two-odd categories are not exactly symmetric. A precise model should use the actual pool counts rather than treating every draw as five independent coin flips.
Count combinations in each category
For exactly k odd white balls, the probability is C(35,k) × C(34,5−k) / C(69,5), where C(n,r) counts unordered selections of r items from n. The formula chooses the odd portion and even portion separately, then divides by all possible five-ball sets. It accounts for selection without replacement within a drawing.
Balanced categories often appear more frequently because many different sets belong to them. That does not make one balanced line more likely than one all-odd line. A category is a collection of outcomes, while a ticket line specifies one outcome. Confusing those levels turns a correct observation about a group into an incorrect claim about an individual selection.
Use patterns as descriptions
For a historical analysis, count how many draws fall into each category, include all six categories, and divide by the total draw count. Compare those percentages with the theoretical category probabilities if you want a learning exercise. Expect differences in finite samples; an exact match between observed and theoretical percentages is not required for a fair drawing.
Filtering a generator to accept only balanced lines changes its output distribution. It may suit a visual preference, but it does not improve the jackpot chance of the one resulting line. Avoid rejecting a valid set merely because its pattern looks unusual. The analyzer can help label odd/even composition while keeping that descriptive result separate from any claim about future success.
Official sources
Game rules and archive references checked October 3, 2026. Calculations and examples are MyBallWin explanations based on the stated assumptions.