Statistics explained
Powerball Number Sums: Range, Average, and Limits
By MyBallWin · Reviewed · 3 min read
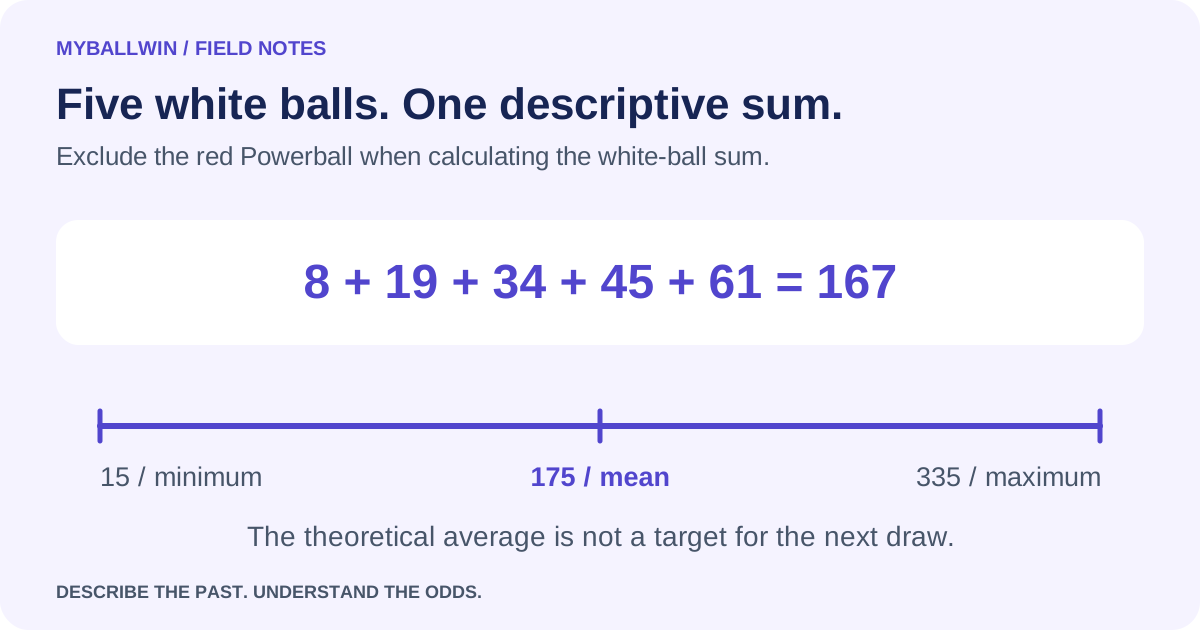
A Powerball white-ball sum is the total of the five white numbers, excluding the red ball. Under the 1–69 format, possible sums range from 15 to 335 and the theoretical mean is 175. A sum is a descriptive feature, not a prediction.
Define the sum before comparing it
For the illustrative white-ball set 8, 19, 34, 45, and 61, the sum is 167. If the red Powerball is 12, adding it produces 179, a different statistic. Both totals can be calculated, but a chart of white-ball sums should use 167 consistently. Mixing definitions can create an apparent trend that is only a bookkeeping difference.
The smallest five distinct eligible white balls are 1, 2, 3, 4, and 5, totaling 15. The largest are 65, 66, 67, 68, and 69, totaling 335. The extremes each identify a single five-ball set. Many different sets produce sums nearer the middle, which explains why a histogram usually concentrates away from the boundaries.
Understand what an average means
The average value of an integer drawn uniformly from 1 through 69 is 35. By linearity of expectation, the expected sum of five white balls is 5 × 35 = 175, even though the balls are selected without replacement. This is a long-run theoretical average, not a target that every drawing or short dataset must approach closely.
A 30-draw sample can have a mean above or below 175. Report both its mean and its range if you want to describe it, and retain the underlying individual sums. A mean alone can hide a broad spread: a collection concentrated near the center and a collection with high and low extremes can share the same average.
Avoid turning a histogram into a filter
A central band of sums can contain a large share of all possible sets. Selecting one set from that band still gives you only one set. Its individual probability is the same as that of a valid extreme-sum set. The greater probability belongs to the entire group of central-sum outcomes, not to every member of the group separately.
Use sum analysis to inspect records, practice statistics, or compare how two fixed periods differ. An impossible sum can also flag bad input, although a plausible sum cannot prove a record is correct. If you filter number suggestions by sum, describe the filter as a preference and keep its limits visible. Historical sum distributions provide no reliable shortcut to the next winning combination.
Official sources
Game rules and archive references checked October 3, 2026. Calculations and examples are MyBallWin explanations based on the stated assumptions.