Statistics explained
Hot and Cold Powerball Numbers: What the Labels Mean
By MyBallWin · Reviewed · 2 min read
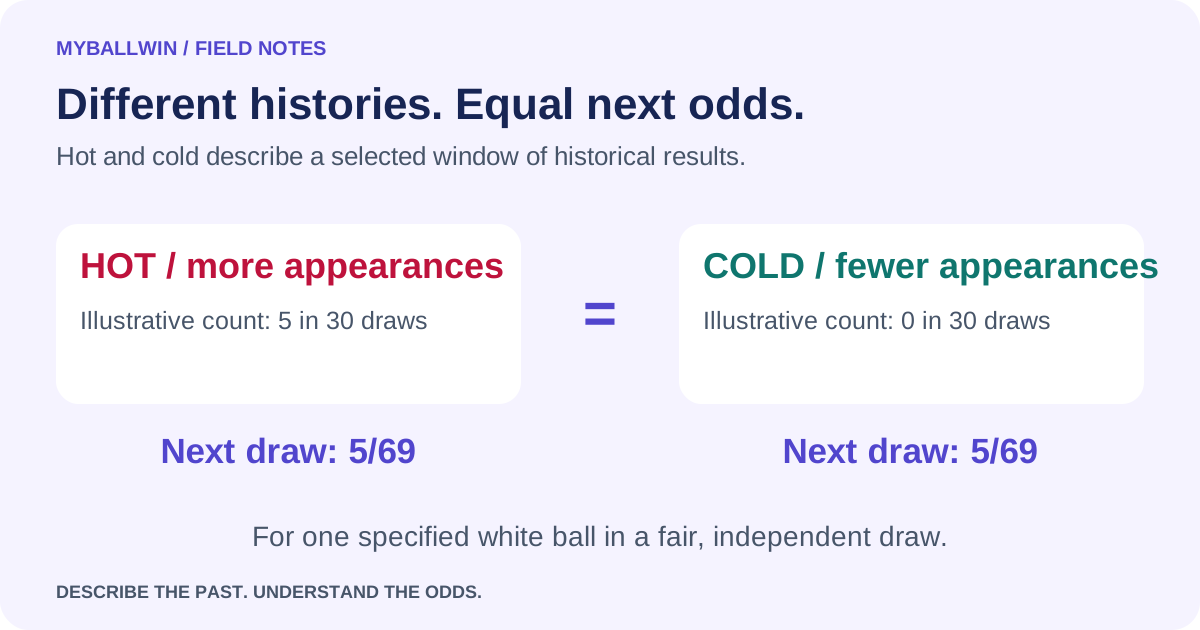
Hot numbers appeared more often in a chosen history window; cold numbers appeared less often. These labels depend on the window and do not change the next-draw probability of an eligible number in a fair, independent drawing.
A label needs a definition
There is no single statistical definition of hot or cold. One chart may label its ten highest counts hot, while another uses counts above an expected average. Those methods can classify the same number differently. Before reading the colors, identify the time period, number pool, rule for ties, and threshold used to assign each label.
Imagine an illustrative 30-draw sample in which number 8 appears five times and number 44 does not appear. Calling 8 hot and 44 cold is a compact description of that sample. Moving the start date can reverse the comparison. Neither name is an enduring property of the physical ball or an instruction about which number to select next.
Separate history from next-draw probability
Under a fair 5-of-69 white-ball drawing, each individual number has a 5/69 chance to appear. The calculation uses the current pool and the five available positions, not the number's recent count. A number that appeared yesterday and one that has been absent for many drawings face the same probability under the independence assumption.
Two opposite stories often arise from the same chart: a hot number is said to have momentum, while a cold number is said to be due. Neither story follows from historical counts alone. Random sequences naturally contain clusters and gaps. To establish a real change in a process would require evidence and testing beyond selecting a visually striking run after it occurred.
Do not confuse frequency with player popularity
A frequently drawn number is not necessarily frequently chosen by players. Draw records describe machine outcomes; popularity requires ticket-selection data. An archive cannot identify the least picked numbers from draw counts alone. Claims about likely prize sharing therefore require a different dataset and should not be inferred from a cold-number table.
Use hot and cold views to explore how a distribution changes over different windows. Keep a neutral record of all counts, including zeros, and compare rates where sample sizes differ. If you select numbers for entertainment, a historical label does not add a mathematical edge to the line. The chart's honest value is explaining the past clearly, with enough context for you to reproduce it.
Official sources
Game rules and archive references checked October 3, 2026. Calculations and examples are MyBallWin explanations based on the stated assumptions.