Data methods
Build a Clean Powerball History Spreadsheet
By MyBallWin · Reviewed · 2 min read
Use one row per drawing, separate columns for the five white balls and red Powerball, and a real drawing-date field. Validate and deduplicate the records before adding formulas. Keep source and coverage notes so another reader can reproduce the analysis.
Choose a structure that preserves meaning
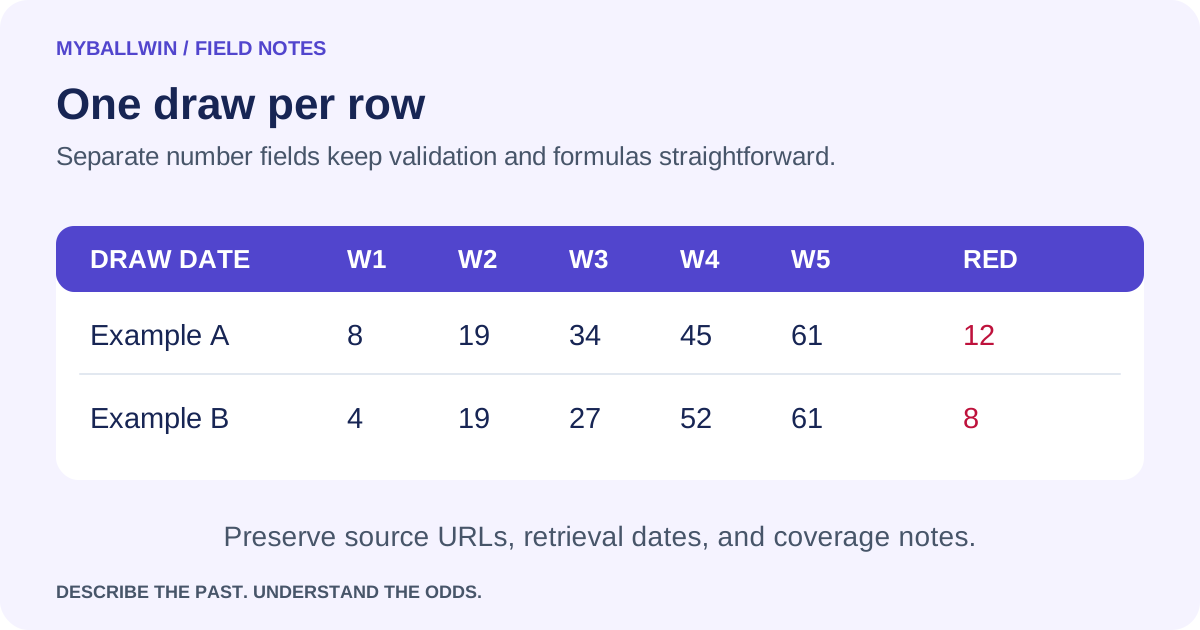
A practical sheet uses column A for the draw date, B through F for the five white balls, and G for the red Powerball. Keep any multiplier in H and source information in separate columns or a notes sheet. Avoid storing all six numbers as an unlabeled text string; that makes sorting, validation, and separate-pool calculations unnecessarily fragile.
Import dates carefully. A display such as 04/05 can be interpreted differently across regional settings. An ISO-style date, YYYY-MM-DD, makes the intended calendar day clearer, although your spreadsheet still needs an appropriate date type for filtering. Preserve the original drawing date rather than replacing it with the file download date or today's date.
Validate before using formulas
For current-format records, check that B through F contain five distinct integers between 1 and 69 and G contains one integer between 1 and 26. Repeated numerals across the white and red pools are allowed. Sort by date and inspect duplicate date/game combinations. If two sources disagree, flag the row and compare it with the official result rather than silently picking one.
For an illustrative sheet with 100 verified draws in rows 2 through 101, =SUM(B2:F2) calculates the first row's white-ball sum. If J2 contains a white number to investigate, =COUNTIF($B$2:$F$101,J2) counts its appearances. Divide that count by 100 for its per-draw rate. Use =COUNTIF($G$2:$G$101,J2) for the red pool instead of combining the two ranges.
Make the workbook auditable
Create a number list containing every eligible value, including values with zero counts. The sum of white-ball frequencies should be 500 for the illustrative 100-draw sheet, while red frequencies should sum to 100. Adjust the formulas and denominators when the actual row count changes; do not include blank rows as if they were completed draws.
Add a notes sheet with the source URL, retrieval date, selected interval, actual draw count, rule format, and unresolved gaps. Keep raw imported data separate from calculated tables so you can revisit a discrepancy. These habits make a useful research workbook. They do not turn a historical spreadsheet into a forecasting model, and any potential ticket match should still be checked with the official lottery.
Official sources
Game rules and archive references checked October 3, 2026. Calculations and examples are MyBallWin explanations based on the stated assumptions.