Data methods
How to Compare Powerball Frequency Across Time Periods
By MyBallWin · Reviewed · 3 min read
Use the same number pool and counting definition, state exact dates, and compare appearances per drawing rather than raw counts. Prefer non-overlapping periods when asking whether two distinct stretches differ, and report uncertainty instead of calling a change predictive.
Make the periods comparable
Start with a clear question, such as whether the observed appearance rates in one completed period differ from those in another. Record the start date, end date, and number of valid draws in each. Do not choose the boundaries only after finding a dramatic contrast. That practice selects the evidence to fit a story and makes the difference look more convincing than it is.
Check that both periods use the same game rules. If the eligible number pool changed, a number's theoretical appearance probability may also have changed. Even when the rules match, compare white balls only with white balls and red Powerballs only with red Powerballs. A shared numeral is not enough to make two measurements comparable.
Normalize counts and retain their context
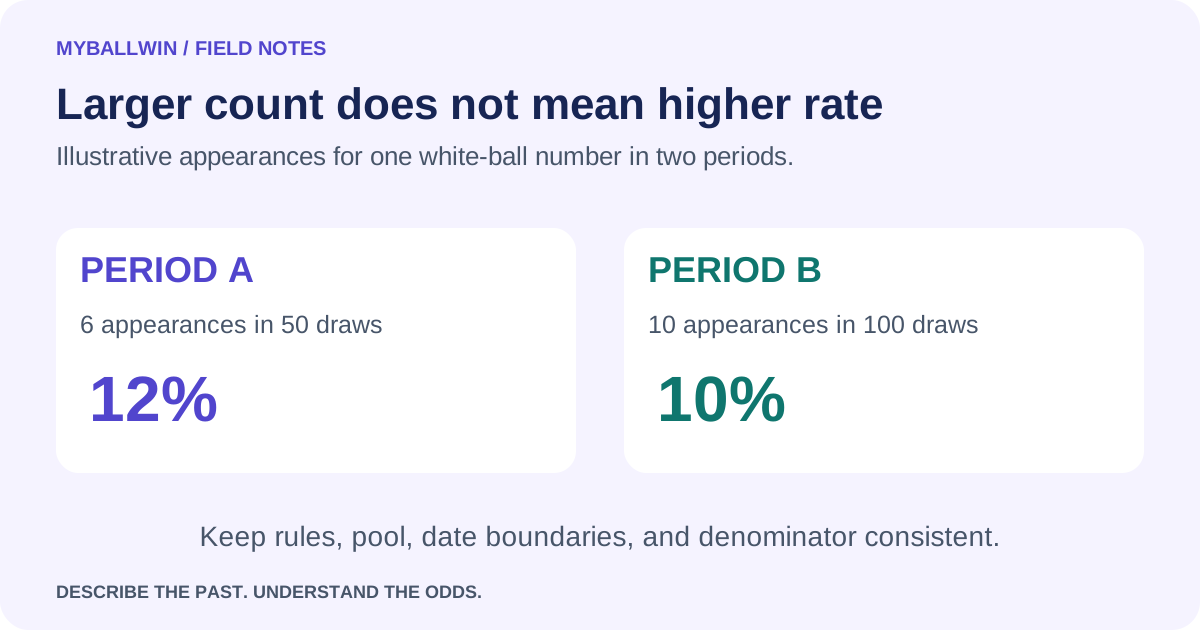
Suppose an illustrative number appears six times in 50 draws in period A and ten times in 100 draws in period B. The respective rates are 12% and 10%. The larger count belongs to B, but the higher per-draw rate belongs to A. Report both numerator and denominator so readers can verify the percentages and see how much data supports them.
Avoid expressing a rise from zero as an ordinary percentage increase. The relative-change denominator would be zero. Report the actual counts and rates instead. Likewise, a move from one occurrence to two is a 100% increase in count, but that wording can obscure how little evidence is involved. Absolute changes and sample sizes are often more informative.
Overlap and many comparisons affect interpretation
A last-30-draw window contained within a last-100-draw window shares every one of its records with the larger period. Agreement is partly built in. If you want two separate samples, use disjoint date ranges and check the boundary carefully so no drawing appears in both. This is especially important when comparing adjacent months or calendar years.
When inspecting 69 numbers, some will rise and others fall simply through random variation. Highlighting only the largest increase hides that wider search. Show the complete table, preserve ties, and distinguish exploratory findings from a hypothesis specified before the data was inspected. The resulting comparison can accurately describe changes in historical rates without implying that the next drawing will continue them.
Official sources
Game rules and archive references checked October 3, 2026. Calculations and examples are MyBallWin explanations based on the stated assumptions.